Sensitivity: what drives the answer
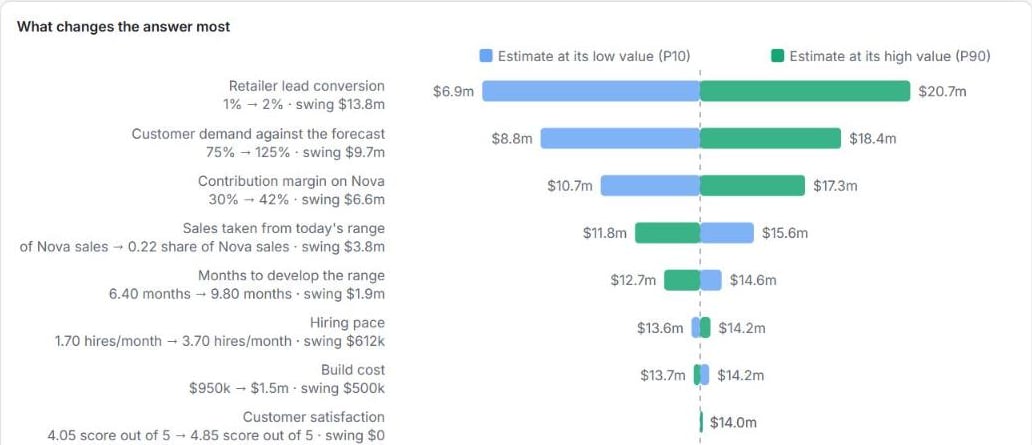
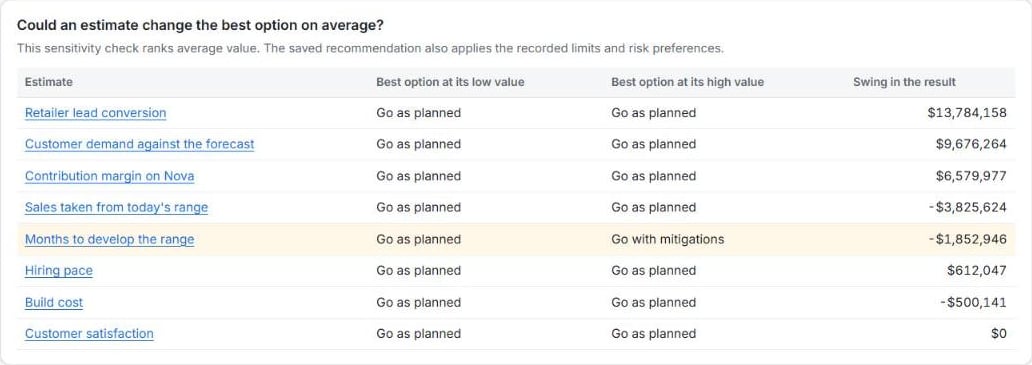
A recommendation is only as strong as the estimates behind it. Sensitivity asks which of your estimates, if wrong, would change the answer. You will meet it in two places:- inside the report, on each objective (the tornado for that goal), and
- in the Sensitivity analyst tool, which works on value and lets you try what-ifs.
In the report: the tornado for an objective
Open an objective in the results and scroll to Sensitivity analysis.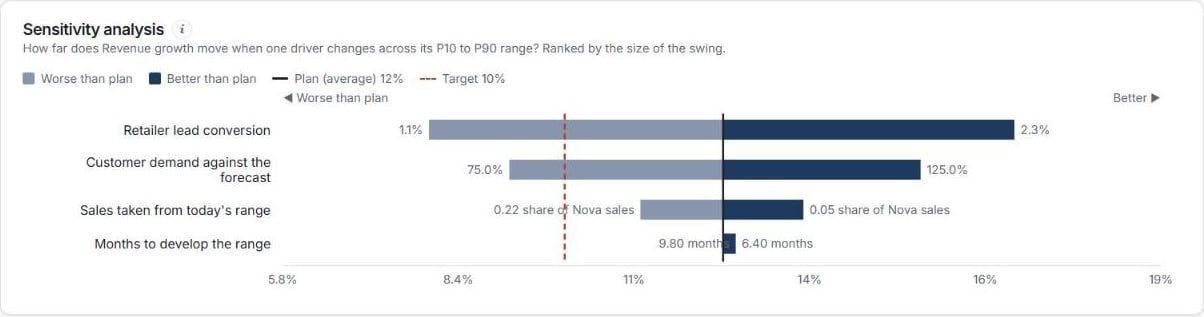
- The longest bars matter most. “Retailer lead conversion” swings revenue growth from about 8% to 16%, far more than “Months to develop the range”.
- A bar that crosses the dashed line means that estimate alone can decide whether you hit the target.
- Put research effort into the estimates at the top. Estimates at the bottom can stay rough.
In the Sensitivity tool
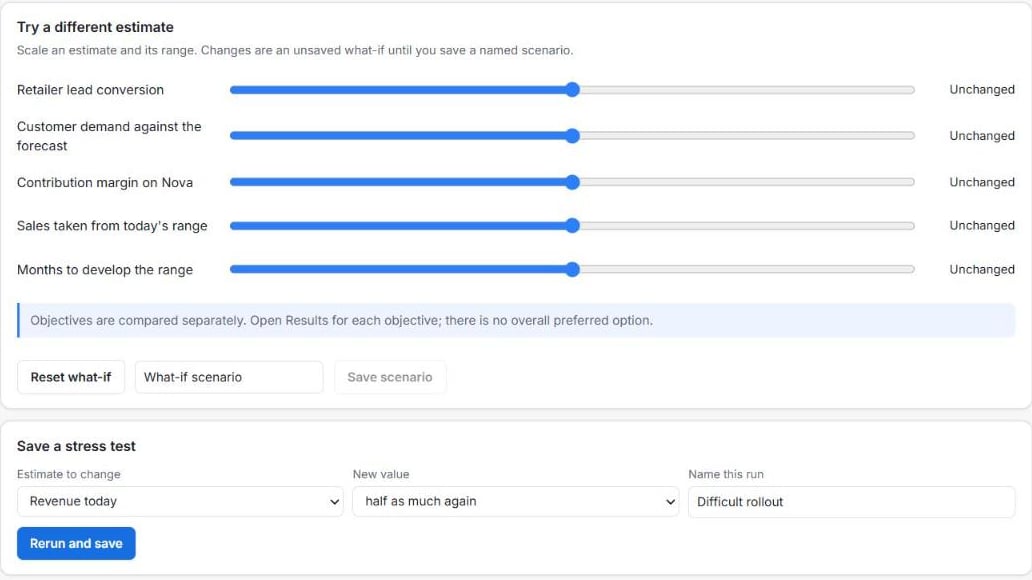
Open Analyst tools, then Sensitivity. It is described as “what moves the answer, what-ifs and stress tests”.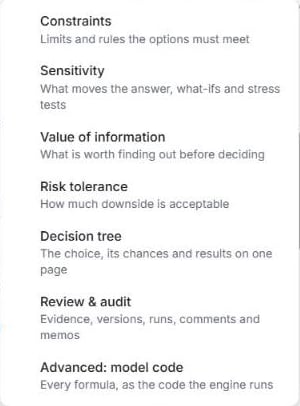
Value of information
Before committing, ask whether it would be worth finding out more first. Value of perfect information (EVPI) is how much better, on average, the decision would be if you could learn the true value of every “what we do not know yet” estimate before choosing. It is the most research could ever be worth.
Keep in mind:
- It is a ceiling, not a budget. A real study is imperfect, costs money and takes time, so it is worth less than EVPI.
- It counts only what research can reveal. Variation that will happen anyway is excluded.
- Zero is a useful answer. If one option wins in nearly every future, learning more cannot change the decision.
The value of a specific study (EVSI) and of learning about a single estimate (EVPPI) are not calculated; only the overall ceiling is.