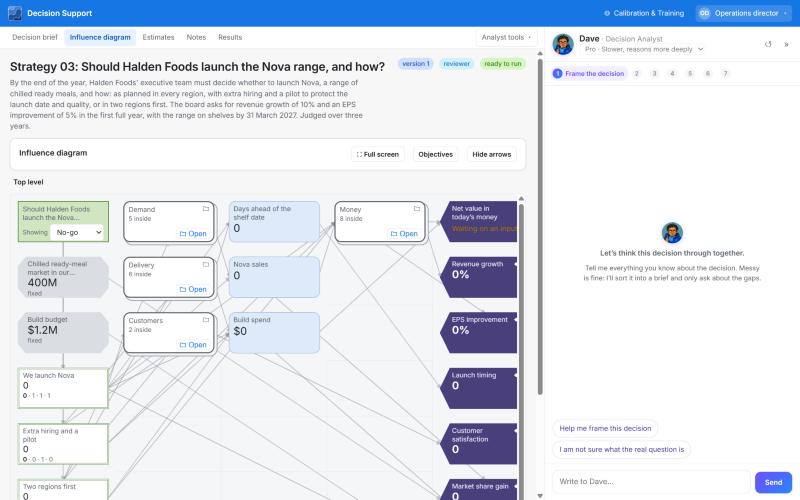
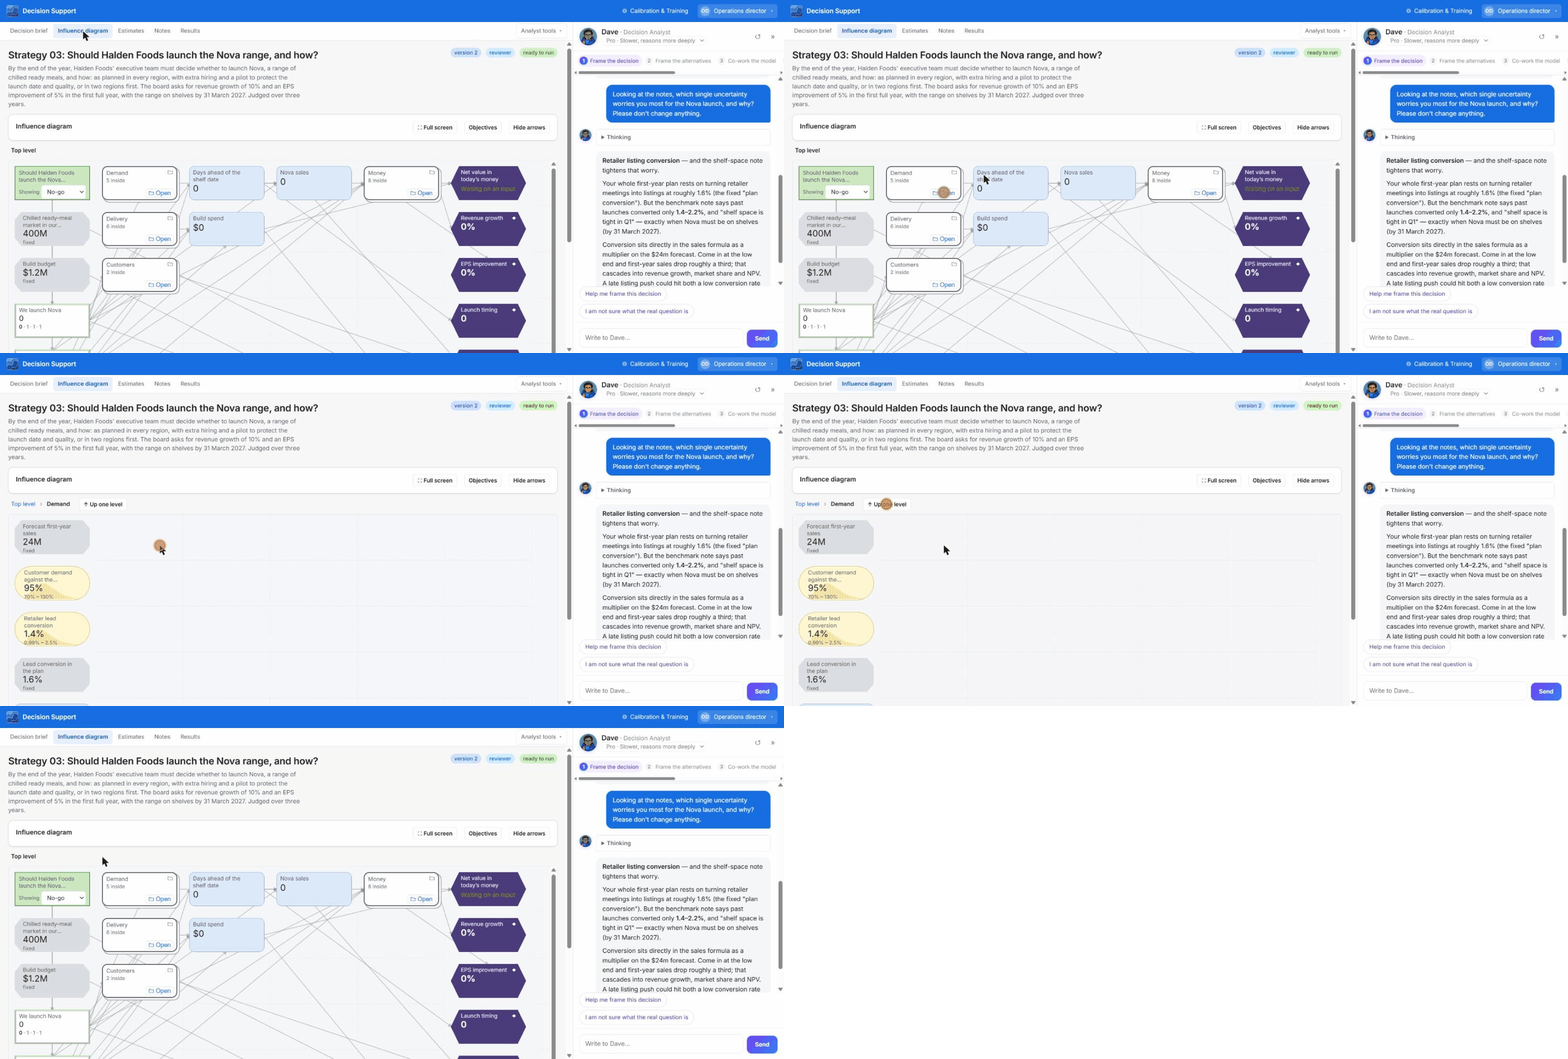
The diagram shows how inputs combine into the outcome. It is generated from the same definition the engine calculates with, so the picture can never disagree with the numbers. Influence diagram of the Halden Foods case Exploring the influence diagram: tracing a box and opening a module

Reading it

Not sure what a shape or colour means? See Types of nodes.
  • Ovals are uncertain or calculated values, rectangles are decisions, the diamond is the outcome.
  • Each box shows its middle value. Arrow colour shows direction and thickness shows weight.
  • Badges show attached evidence and whether sources support the assumed direction.
  • Point at a box to trace everything it affects. Click a box or arrow for detail, evidence and research buttons.

Editing it

Editing needs the editor role.
1

Choose Edit diagram

2

Add boxes

Pick a type from the palette (uncertain, fixed, calculation, module) and click the canvas.
3

Draw arrows

Drag from the handle on a box’s right edge to another box.
4

Write formulas

Open a calculation to write its formula. Boxes with arrows into it are listed as inputs you can insert with one click. Using a variable draws its arrow; dropping it removes the arrow.
5

Save

Edits are a draft with undo until you choose Save as a new version.
Keyboard drawing: select a box and press Tab to add what it depends on, Enter to add another, type to name it, Alt+Enter to open its formula.

Big models

Group boxes into modules (double-click one to open it; the breadcrumb leads back). Group into modules by section gives a starting point. The Boxes table under the diagram lists every box for finding, renaming, retyping and bulk deleting.

Mind map

The Mind map switch shows the same model as a driver tree. Tab adds a driver, Enter another, Ctrl+Enter inserts a calculation, Ctrl+G groups the selection into a module.
Keep the diagram to what actually drives the outcome. See Best practice.
Next: Set estimates